
1. Dirixímonos á seguinte páxina
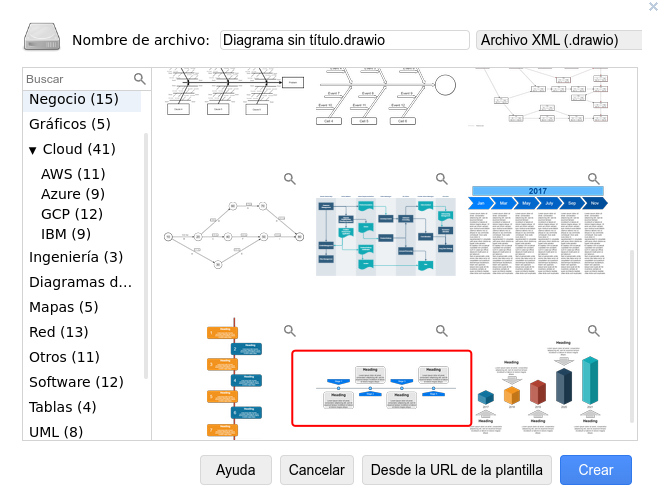
2. Prememos en Archivo > Nuevo e escollemos un diagrama que nos guste. Neste exemplo escollerei unha liña temporal, para empregar na materia de Ciencias Sociais ou Xeografía e Historia. Pinchamos en crear e inserimos o nome do ficheiro.
3. Pinchamos en Extras > Editar diagrama e procedemos a copiar ese código que lle servirá á intelixencia artificial como modelo
4. Abrimos chatGTP, e introducimos o prompt. Obviamente canto máis potente sexa a intelixencia empregrada, o resultado será mellor, e aínda así teremos que retocar manualmente o gráfico.
Utilizando el siguiente código como ejemplo, podrías adaptarlo para representar las etapas históricas de la humanidad, desde la prehistoria hasta la edad contemporanea, creando los elementos que sean necesarios y dándole el tamaño al lienzo y a los elementos para quedar ajustado.
<mxGraphModel dx="1192" dy="730" grid="1" gridSize="10" guides="1" tooltips="1" connect="1" arrows="1" fold="1" page="1" pageScale="1" pageWidth="1100" pageHeight="850" background="none" math="0" shadow="0"> <root> <mxCell id="0" /> <mxCell id="1" parent="0" /> <mxCell id="4ec97bd9e5d20128-1" value="" style="line;strokeWidth=2;html=1;fillColor=none;fontSize=28;fontColor=#004D99;strokeColor=#004D99;" parent="1" vertex="1"> <mxGeometry x="40" y="400" width="1000" height="10" as="geometry" /> </mxCell> <mxCell id="4ec97bd9e5d20128-5" value="Stage 1" style="shape=offPageConnector;whiteSpace=wrap;html=1;fillColor=#0075E8;fontSize=15;fontColor=#FFFFFF;size=0.5093750000000015;verticalAlign=top;strokeColor=none;" parent="1" vertex="1"> <mxGeometry x="120" y="340" width="160" height="40" as="geometry" /> </mxCell> <mxCell id="4ec97bd9e5d20128-6" value="<span>Stage 3</span>" style="shape=offPageConnector;whiteSpace=wrap;html=1;fillColor=#0075E8;fontSize=15;fontColor=#FFFFFF;size=0.5093750000000015;verticalAlign=top;strokeColor=none;" parent="1" vertex="1"> <mxGeometry x="573" y="340" width="160" height="40" as="geometry" /> </mxCell> <mxCell id="4ec97bd9e5d20128-7" value="<span>Stage 2</span>" style="shape=offPageConnector;whiteSpace=wrap;html=1;fillColor=#0075E8;fontSize=15;fontColor=#FFFFFF;size=0.4178571428571445;flipV=1;verticalAlign=bottom;strokeColor=none;spacingBottom=4;" parent="1" vertex="1"> <mxGeometry x="347" y="425" width="160" height="35" as="geometry" /> </mxCell> <mxCell id="4ec97bd9e5d20128-8" value="<span>Stage 4</span>" style="shape=offPageConnector;whiteSpace=wrap;html=1;fillColor=#0075E8;fontSize=15;fontColor=#FFFFFF;size=0.4178571428571445;flipV=1;verticalAlign=bottom;strokeColor=none;spacingBottom=4;" parent="1" vertex="1"> <mxGeometry x="800" y="425" width="160" height="35" as="geometry" /> </mxCell> <mxCell id="4ec97bd9e5d20128-9" value="" style="ellipse;whiteSpace=wrap;html=1;fillColor=#61BAFF;fontSize=28;fontColor=#004D99;strokeWidth=3;strokeColor=#004D99;" parent="1" vertex="1"> <mxGeometry x="190" y="395" width="20" height="20" as="geometry" /> </mxCell> <mxCell id="4ec97bd9e5d20128-10" value="" style="ellipse;whiteSpace=wrap;html=1;fillColor=#61BAFF;fontSize=28;fontColor=#004D99;strokeWidth=3;strokeColor=#004D99;" parent="1" vertex="1"> <mxGeometry x="417" y="395" width="20" height="20" as="geometry" /> </mxCell> <mxCell id="4ec97bd9e5d20128-11" value="" style="ellipse;whiteSpace=wrap;html=1;fillColor=#61BAFF;fontSize=28;fontColor=#004D99;strokeWidth=3;strokeColor=#004D99;" parent="1" vertex="1"> <mxGeometry x="643" y="395" width="20" height="20" as="geometry" /> </mxCell> <mxCell id="4ec97bd9e5d20128-13" value="" style="ellipse;whiteSpace=wrap;html=1;fillColor=#61BAFF;fontSize=28;fontColor=#004D99;strokeWidth=3;strokeColor=#004D99;" parent="1" vertex="1"> <mxGeometry x="870" y="395" width="20" height="20" as="geometry" /> </mxCell> <mxCell id="4ec97bd9e5d20128-14" value="<h1>Heading</h1><p>Lorem ipsum dolor sit amet, consectetur adipisicing elit, sed do eiusmod tempor incididunt ut labore et dolore magna aliqua.</p>" style="text;html=1;spacing=5;spacingTop=-20;whiteSpace=wrap;overflow=hidden;strokeColor=none;strokeWidth=3;fillColor=#E6E6E6;fontSize=13;fontColor=#000000;align=center;rounded=1;" parent="1" vertex="1"> <mxGeometry x="93" y="430" width="215" height="120" as="geometry" /> </mxCell> <mxCell id="4ec97bd9e5d20128-16" value="<h1>Heading</h1><p>Lorem ipsum dolor sit amet, consectetur adipisicing elit, sed do eiusmod tempor incididunt ut labore et dolore magna aliqua.</p>" style="text;html=1;spacing=5;spacingTop=-20;whiteSpace=wrap;overflow=hidden;strokeColor=none;strokeWidth=3;fillColor=#E6E6E6;fontSize=13;fontColor=#000000;align=center;rounded=1;" parent="1" vertex="1"> <mxGeometry x="319" y="250" width="215" height="120" as="geometry" /> </mxCell> <mxCell id="4ec97bd9e5d20128-17" value="<h1>Heading</h1><p>Lorem ipsum dolor sit amet, consectetur adipisicing elit, sed do eiusmod tempor incididunt ut labore et dolore magna aliqua.</p>" style="text;html=1;spacing=5;spacingTop=-20;whiteSpace=wrap;overflow=hidden;strokeColor=none;strokeWidth=3;fillColor=#E6E6E6;fontSize=13;fontColor=#000000;align=center;rounded=1;" parent="1" vertex="1"> <mxGeometry x="545" y="430" width="215" height="120" as="geometry" /> </mxCell> <mxCell id="4ec97bd9e5d20128-18" value="<h1>Heading</h1><p>Lorem ipsum dolor sit amet, consectetur adipisicing elit, sed do eiusmod tempor incididunt ut labore et dolore magna aliqua.</p>" style="text;html=1;spacing=5;spacingTop=-20;whiteSpace=wrap;overflow=hidden;strokeColor=none;strokeWidth=3;fillColor=#E6E6E6;fontSize=13;fontColor=#000000;align=center;rounded=1;" parent="1" vertex="1"> <mxGeometry x="773" y="250" width="215" height="120" as="geometry" /> </mxCell> </root> </mxGraphModel>
5. O chatGPT facilitaranos un código, que copiamos e pegamos na páxina de diagrams.net, substituíndo ao que nos dera de exemplo (Extras > Editar diagrama)

Ficheiro
codigo_0.txt
(3.43 KB)