What, when and how to use an infographic
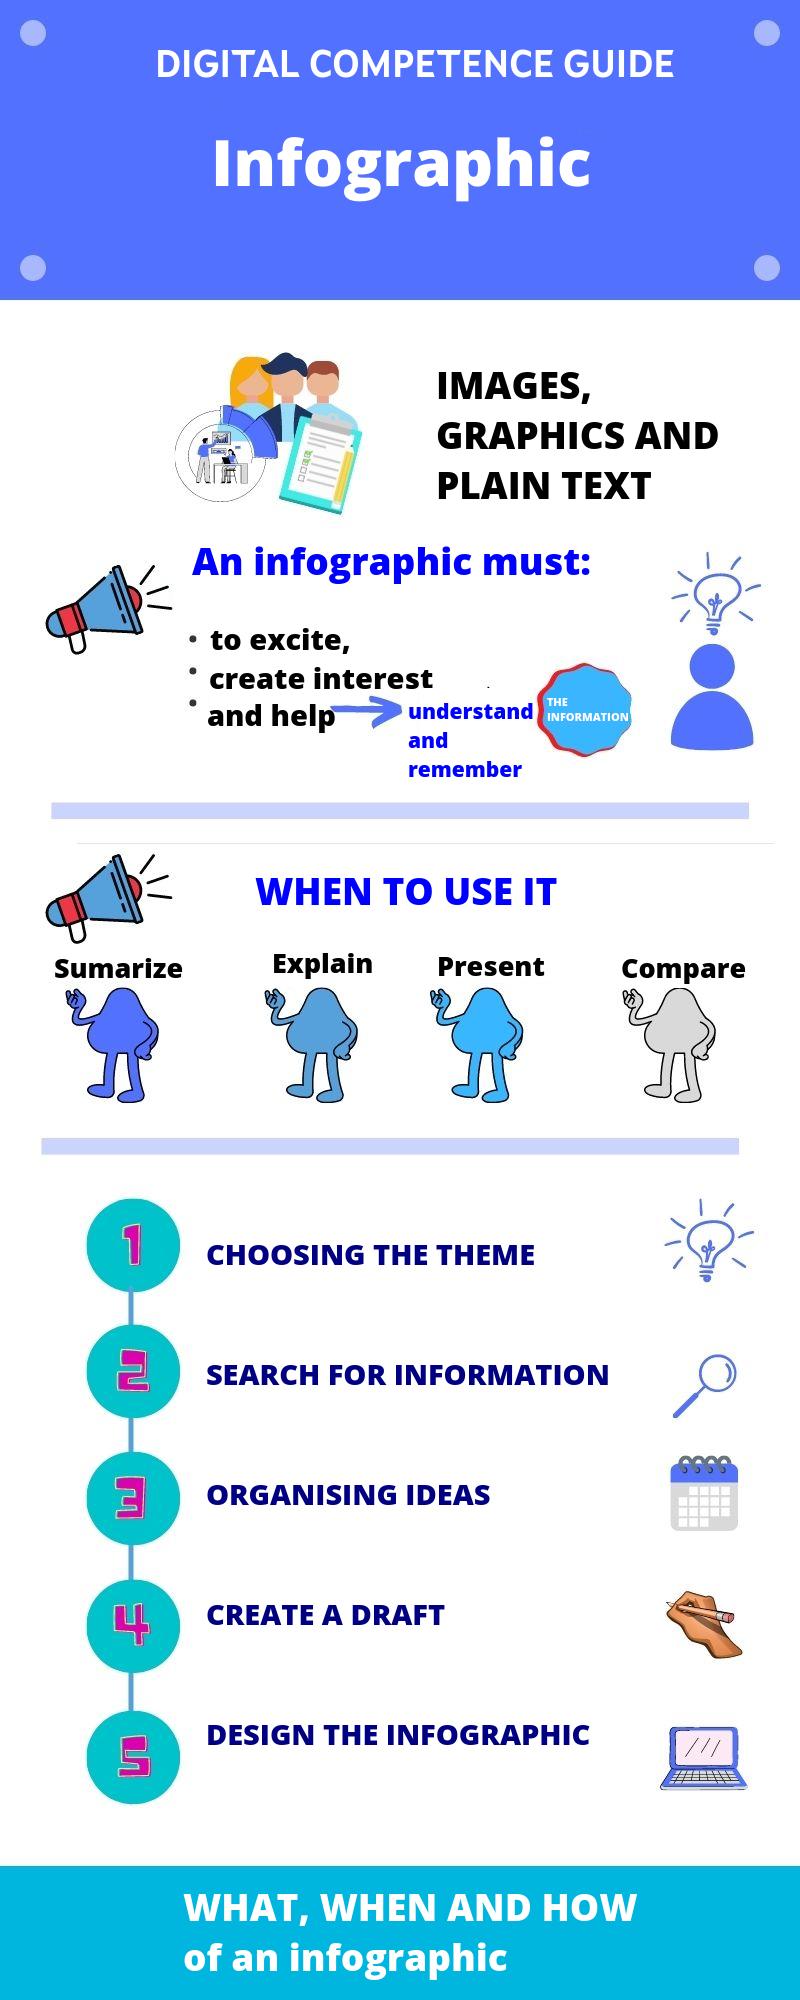
It is the visual representation of information and data. That is to say: An infographic is a collection of images, graphics and simple text that summarizes a topic so that it can be easily understood..
That?
An infographic should:
- Thrill
- Create interest.
- Facilitate Understanding the content
- Help remember your content,
When?
Always use an infographic:
- Summary on a topic.
- Explain a complex process.
- Present the results of an investigation or the data of a survey.
- Compare different options.
As?
1st Choose the theme
2º Identify the sources of information. That is, an infographic is a summary or presentation of a work. The first thing is to have the job.
3º Organize the ideas.
4º Make the draft (choose template)
5º Design (colors, font, icons...).
Software
Canva, impress, genially…
The example is created with Canva.
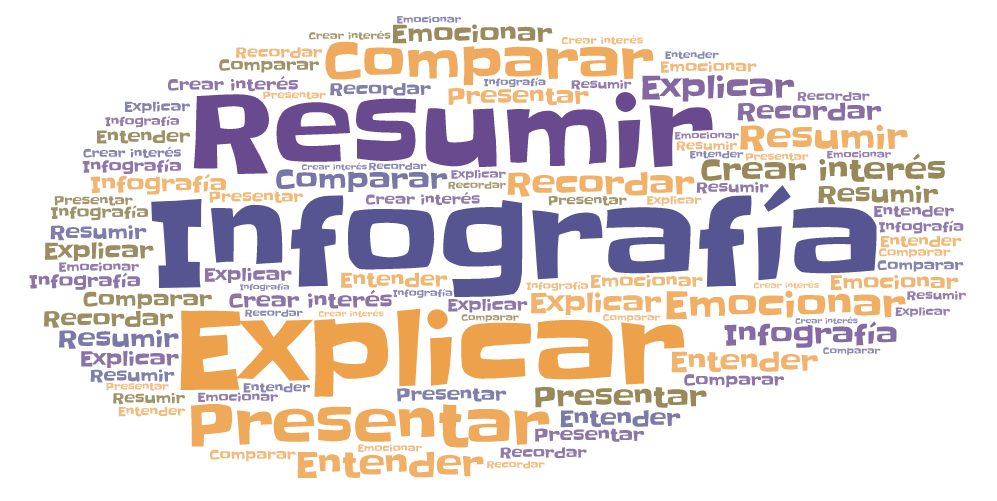
Tag cloud cloud
They are a type of infographic. They are a very useful resource and complement any job very well. You can use the following address to create your word clouds (tag clouds).
https://wordart.com/chsx60vsgyn1/nube-de-palabr